Sept. 02, 2025 | CREB
Price declines mostly driven by higher density home types
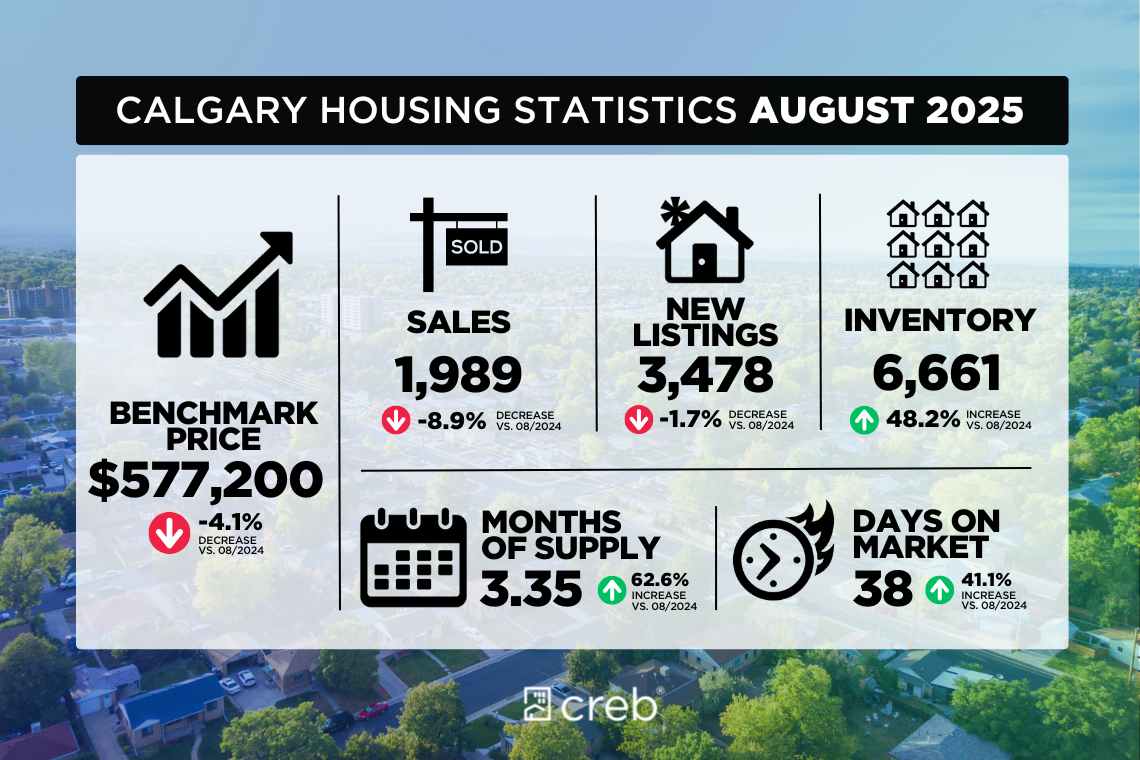
Improving supply choice has changed the dynamics of the Calgary market driving price declines over the past several months.Higher price adjustments are occurring for apartment and row style properties while detached and semi-detached properties have reported modest declines. As of August, the unadjusted total residential benchmark price was $577,200, down over last month and nearly four per cent lower than levels reported last year.
“Perspective is needed when it comes to price adjustments. The most significant price adjustments are occurring for row and apartment style homes as they are also the product type that are facing the largest gains in supply choice,” said Ann-Marie Lurie, Chief Economist at CREB®. “Meanwhile price adjustments in the detached and semi-detached markets range from modest price growth in some areas to larger price declines in areas with large supply growth. Overall, recent price adjustments have not offset all the gains that have occurred over the past several years.”
August reported 1,989 sales, nearly nine per cent lower than last year. Sales have slowed compared to the high levels reported over the past four years. However, activity is still above long-term trends, reflecting relatively strong demand. What has changed is the supply situation. New listings remain elevated, keeping the sales-to-new-listings ratio below 60 per cent and pushing inventory to 6,661, the highest August amount since 2019.
More inventory choice coupled with lower sales has caused the months of supply to rise to 3.4 months in August, much higher than the sellers' market conditions reported over the previous four years, but still well below the buyer market conditions observed prior to the pandemic. While the market is much more balanced compared to last year, there is significant variation depending on property type, price range and location.
Detached
Detached home sales eased to 995 units in August, while new listings rose to 1,748 units, keeping the sales-to-new listings ratio below 60 per cent. This prevented any significant shift in inventory, as the 3,051 units were the highest levels reported in August since 2020. Higher inventory levels and easing supply have helped balance out the detached market. However, districts like the North East, North and East are experiencing buyer market conditions.
The unadjusted benchmark price in August was $755,600 down by nearly one per cent over last month and last year's levels. While prices have eased there is significant variation depending on location. Compared to last year, prices reported the largest decline in the North East and East district at five per cent, while prices in the city centre were over two per cent higher. As many of the adjustments have occurred over the past few months, year-to-date Calgary prices remain two per cent higher than last year.
Semi-Detached
August sales improved over last year’s levels, but it was not enough to offset earlier pullbacks with year-to-date sales of 1,557—eight per cent lower than last year—but higher than long-term trends. At the same time, new listings slowed compared to sales pushing the sales-to-new listings ratio up to 67 per cent and preventing any further monthly inventory gains. Inventory gains have not been as high for this product type, and the months of supply remained below three months in August. This is one of the reasons that the prices have not seen the same adjustment.
In August the unadjusted benchmark price was $687,200 down over last month, but nearly one per cent higher than last year, and nearly four per cent higher on a year-to-date basis. Price growth has varied across the city, with the largest year-over-year gains occurring in city centre. Meanwhile the largest declines have occurred in the North East, East and North districts.
Row
Sales in August slowed, contributing to the year-to-date decline of nearly 16 per cent. While new listings did ease in August compared to last year and last month, they have generally been on the rise pushing up inventory levels. In August, there were 1,103 units in inventory, reaching the second highest level on record for August, only slightly lower than the record high in reported in 2018. Due to the relatively strong sales, the months of supply has only pushed slightly above three months, far more balanced than last year, but not as high as the 6.4 months report back in 2018.
Nonetheless, additional supply choice has weighed on prices. In August, the unadjusted benchmark price in the city was $439,600, reflecting the fourth consecutive monthly decline and nearly five per cent lower than last August. While prices eased across all districts, price declines exceeded five per cent in the North East, North, South and East districts. These districts generally reported high levels of supply in the resale sector or had significant competition from new home supply.
Apartment Condominium
Sales continue to slow in August contributing to a year-to-date pullback of nearly 30 per cent. While sales are still above long-term trends, they have not been high enough to offset the level of new listings in the market. In August alone there were 877 new listings compared to the 449 sales, keeping the sales-to-new-listings ratio relatively low at 51 per cent. The low ratio that has persisted throughout this year has contributed to the higher inventory levels seen in the market. While August inventory levels did not rise over last month, with 1,979 units available, this is the highest August inventory ever reported.
The months of supply for apartment condos have remained around four months since June. The excess supply relative to demand has been weighing on prices. As of August, the unadjusted benchmark price was $326,500, reflecting the fifth consecutive monthly decline and nearly six per cent lower than levels reported last August. Most of the supply is concentrated in the City Centre, which reported a year-over-year decline of five per cent, slightly higher than the rate of decline reported in the West district at three per cent. Meanwhile, the highest price declines occurred in the North East district at over 11 per cent.
REGIONAL MARKET FACTS
Airdrie
Easing sales in August contributed the year-to-date decline of 12 per cent for 1,248 sales so far this year. The 152 sales this month was met with 265 new listings, pushing the sales-to-new listings ratio up to 57 per cent and preventing any further monthly inventory gains. As of August, there was 535 units in inventory, above long-term trends and the highest levels reported since before the pandemic. The rise in supply has helped shift the market to more balanced conditions. However, with more supply options in both the new home, resale markets and in competing locations, there has been some downward pressure on prices in Airdrie. In August, the unadjusted total residential benchmark price was $531,100, down over last month and four per cent lower than levels reported last August.
Cochrane
The 70 sales this month were met with 139 new listings causing the sales-to-new listings ratio to fall to 50 per cent, the lowest ratio reported for August since 2015. The pullback in sales compared to new listings prevented any significant shift in inventory levels, pushed the months of supply up above four months. Despite the shift this month, prices in Cochrane remained relatively stable in August, with the unadjusted benchmark price sitting at $589,100, similar to last month and nearly two per cent higher than last year. On a year-to-date basis prices are four per cent higher than the previous year.
Okotoks
New listings in August reported a significant pullback relative to sales and the sales-to-new-listings ratio pushed up to 80 per cent. While sales have generally remained in line with long-term trends, new listings have not had the same increase that other areas have reported, preventing significant gains in inventory levels. As of August, there was 116 units in inventory, a 29 per cent gain over last year, but still 30 per cent lower than levels traditionally seen in August. Despite tighter conditions, prices have reported some monthly declines. However, year-to-date benchmark prices remained two per cent higher than last year’s levels, with gains reported across each property type.
Click here to view the full City of Calgary monthly stats package.
Click here to view the full Calgary region monthly stats package.
Tagged: Monthly stats | Housing Market


Related Articles
