Feb. 05, 2016 |
Five things about housing stats
Understanding the lingoCREB® released its regional housing market statistics earlier this week for January, showing the residential housing market is continued to be challenged by energy sector uncertainty. But what does it mean for homeowners?
CREB®Now breaks down the lingo in this week's "Five Things" feature.
Sales
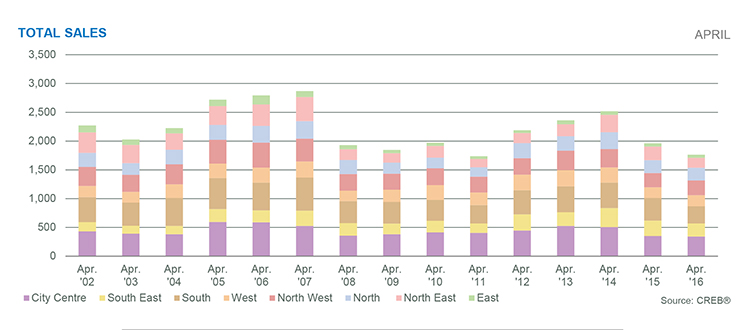
CREB® reported that sales of all housing types in Calgary are down 13 per cent from last January to 763 units. By segment, however, a slightly different story begins to unfold. While sales in the detached market decreased by an identical 13 per cent, the attached sector dropped by just over 10 per cent, while the apartment sector fell by a precipitous 16 per cent. For sellers, this shows which segments are more active than others – keeping in mind that the detached sector still represents nearly two-thirds of all sales activity.
Listings
New listings decreased in Calgary by 16 per cent from January 2014 to 2,741 units. Is that a good thing? After all, fewer sales plus fewer listings means more balanced conditions, right? In January, however, the decrease in new listings was not enough to offset the decrease in sales that started early last year. As a result, active inventory was up last month by nearly five per cent to 5,022 units. For buyers, this means more choices and some price advantages. For sellers, this shows how competitive the market is.
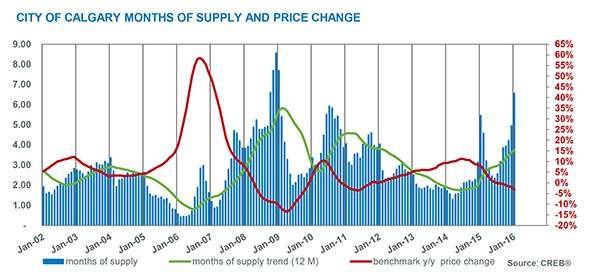
Months of supply
Months of supply is the time it would take for the current inventory to sell at the current rate without new inventory coming on the market. It's calculated by dividing the number of houses currently for sale by the average number of homes sold per month – for Calgary, that worked out to seven in January. A buyers' market in Calgary is one that generally has over three months of supply for more than three months. Calgary has been over three months since August.
Days on market
Days on market represents the average time it takes for a property to sell. In January, it took 50 days, a 21 per cent increase from the same time last year. For sellers, knowing this can help manage expectations on how quickly their homes will sell – keeping in mind that there are variations based on price ranges.
Benchmark price
CREB® uses benchmark price because it compares changes in price for the same type of home. Using average price as a barometer of the market can be misleading due to price reductions or shifts in the composition of what's sold. For January, the benchmark price in Calgary was $447,300, a 3.3 per cent decrease from last year and 1.2 per cent from the previous month. More substantial price declines occurred in the oversupplied apartment market than the detached and attached markets.
Tagged: benchmark price | buyer's market | Calgary Real Estate News | Calgary Real Estate News | days on market | Five things | listings | Monthly Housing Summary | months of supply | Residential | sales | YYCRE


Related Articles
